Reports - Logins Report (Sysadmin)
Reports – Logins Report (Sysadmin)
TABLE OF CONTENTS
Overview
Admin setting: The report is available under Administration > Reports.
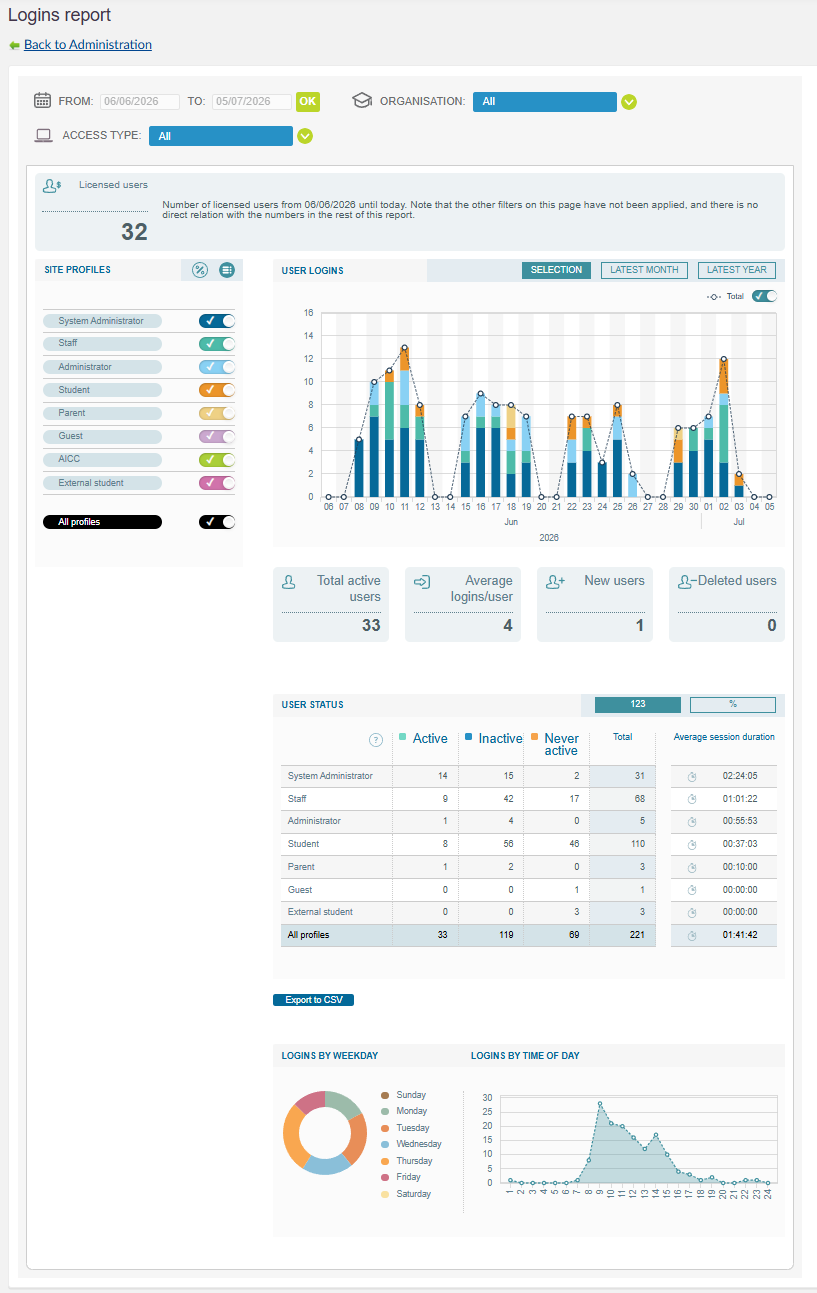
The Logins report lets you view user login trends and statistics for your site and organisations. The report shows logins over time, login statistics per site profile, user status counts, and login patterns by weekday and time of day.
Filters
At the top of the report, you can filter the data by:
| Filter | Description |
|---|---|
| From / To | Select the date range for the report. Click OK to apply. |
| Organisation | Limit the report to a specific organisation, or view all. |
| Access type | Limit the report to a specific access type, or view all. |
Report sections
Licensed users
The Licensed users box shows the number of licensed users from the selected start date until today. The other filters on the page are not applied to this number, and there is no direct relation with the numbers in the rest of the report.
Site profiles
The Site profiles panel lists the site profiles on your site, for example System Administrator, Staff, Student, and Parent. Use the toggles to include or exclude profiles from the report, or use All profiles to toggle all profiles at once. You can switch the display between numbers and percentages.
User logins
The User logins chart shows logins per day within the selected period, broken down by site profile. A total line can be toggled on or off. Use the Selection, Latest month, and Latest year tabs to switch the time period shown in the chart.
Key figures
Below the chart, the report shows the following key figures for the selected period:
- Total active users
- Average logins/user
- New users
- Deleted users
User status
The User status table shows, per site profile, the number of users in each status, along with the total and the average session duration. A summary row shows the totals for all profiles. You can switch the display between numbers and percentages.
| Status | Description |
|---|---|
| Active | Users who have logged in during the selected time period. |
| Inactive | Users who have not logged in during the selected time period, but who have logged in at other times. |
| Never active | Users who have never logged in. |
Logins by weekday and time of day
At the bottom of the report, two charts show login patterns:
- Logins by weekday: The distribution of logins across the days of the week.
- Logins by time of day: The distribution of logins across the hours of the day.
Exporting the data
Click Export to CSV below the user status table to export the data for further analysis.
More Help Resources
Have more questions? Please start with asking your school administrator.
Product Release notes
Stay updated with itslearning latest releases: https://itslearning.com/product-updates
Service Status
Check the current status of itslearning services: https://status.itslearning.com/
Ideas Portal
Share your ideas and help shape the future of itslearning: https://ideas.itslearning.com/
Roadmap
Check out our roadmap: https://itslearning.com/global/roadmap/